Data Analysis Questions
In the examples you have just completed, you were faced with the major types of bias. There are many different ways of categorizing biases. We choose to classify biases based on two general schemes: whether the bias is caused by selection of individuals into the study, or by the information obtained from the participants during the study (selection vs. information bias), and whether the resulting bias is likely to be non-differential or differential.
Selection Bias
An error due to selection of cases and controls based on differing criteria that are related to exposure status, or selection (or follow-up) of exposed and unexposed individuals in a way that is related to the development of the outcome. Self-selection and volunteer bias, among others, fall under the category of selection bias.
Information or Observation Bias
Bias arising from errors in exposure or disease classification (also known as measurement error). Recall bias is the most common form of information bias.
Information bias can manifest in two ways:
Non-differential:
- If misclassification of exposure is UNRELATED to disease
- If misclassification of disease is UNRELATED to exposure
- Effect = Bias towards the null (OR and RR closer to 1.0)
Differential:
- If misclassification of exposure is RELATED to disease
- If misclassification of disease is RELATED to exposure
- Effect = Bias can go in either direction from the null; it can inflate or attenuate your effect estimates (OR and RR)
Understanding the effects of differential and non-differential misclassification are among the most subtle and challenging aspects of studying bias. For some examples of these types of misclassification, work through the following scenarios.
Examples of Misclassification
Please Note: Everything that follows will be based on the 2×2 table of the association between lawn/garden pesticide use and breast cancer reported in Teitelbaum et al. (2007). For the purpose of this example, we are going to assume that the effect measure reported in the study is the "truth". That is, there was no misclassification in the Teitelbaum et al. (2007) study. Obviously, we never know the "truth" in epidemiology, and certainly at least some misclassification is likely in the measures reported in Teitelbaum et al. (2007). But for the purpose of the exercise, let's assume that exposure and disease were measured perfectly. Disease status (breast cancer) will be labeled as D+ (breast cancer) and D- (no breast cancer). Exposure to lawn/garden pesticides will be labeled as E+ and E-.
|
|
|||
|---|---|---|---|
| Breast cancer + | Breast cancer - | Total | |
| Ever used lawn/garden pesticides | 1,254 | 1,231 | 2,485 |
| Never used lawn/garden pesticides | 240 | 305 | 545 |
| Total | 1,494 | 1,536 | 3,030 |
Let us assume that the "true" estimate of the association between lawn/garden pesticide use and breast cancer is OR = (1254/240)/(1231/305) = 1.29. Let's see how different types of misclassification can bias the estimate.
Scenario #1:
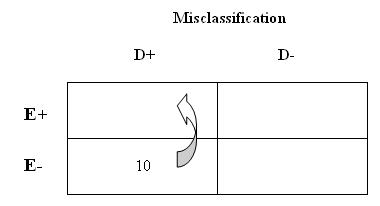
Some of the cases were confused about how you defined lawn/garden pesticide use. Because they were extraordinarily concerned with finding the cause of their breast cancer, 10 of the cases reported that they had been exposed when in fact they had not been exposed. Therefore, among those with breast cancer, you have misclassified 10 people who are in "truth" unexposed as exposed.
6. What is the effect of this misclassification on the odds ratio?
| Scenario 1 | |||
|---|---|---|---|
|
Breast cancer +
|
Breast cancer -
|
Total
|
|
| Ever used lawn/garden pesticides |
1264
|
1231
|
2495
|
| Never used lawn/garden pesticides |
230
|
305
|
535
|
| Total |
1494
|
1536
|
3030
|
OR = (1,264/230)/(1,231/305) = 1.36
Your effect estimates have been inflated (i.e., biased away from the null). This makes sense because you have increased the 'a' cell (D+E+) thereby increasing the numerator of your estimates. What else is important here? You have misclassified exposure among diseased persons only (think about 2 ways this could happen in a study); therefore, because misclassification of exposure is linked to disease status, Scenario #1 is an example of differential misclassification in which the effect estimates were biased away from the null.
Scenario #2:
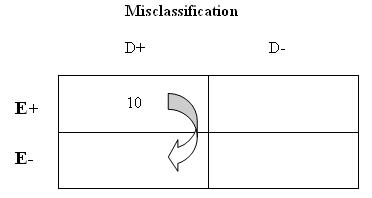
Now suppose that 10 of the cases forgot about their lawn/garden pesticide exposure, while all of the controls still remembered perfectly. Therefore, among those with disease, you have misclassified 10 people who in "truth" were exposed as unexposed.
7. What is the effect of this misclassification on the odds ratio?
| Scenario 2 | |||
|---|---|---|---|
|
Breast cancer +
|
Breast cancer -
|
Total
|
|
| Ever used lawn/garden pesticides |
1244
|
1231
|
2475
|
| Never used lawn/garden pesticides |
250
|
305
|
555
|
| Total |
1494
|
1536
|
3030
|
OR = (1,244/250)/(1,231/305) = 1.23
Now, your effect estimates have been attenuated (i.e., biased towards the null). Again, this makes sense because you have increased your 'c' cell (D+E-) thereby increasing the denominator of your estimates. Like Scenario #1, you misclassified exposure to lawn/garden pesticides only among individuals with breast cancer. Because your misclassification is linked to disease status, this too is an example of differential misclassification in which the effect estimate was biased towards the null.
Scenario #3:
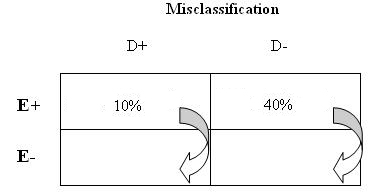
When compared with the "truth", you have misclassified 10% of your D+E+ ('a' cell: people exposed to lawn/garden pesticides with a diagnosis of breast cancer) as D+E- ('c' cell: people not exposed to lawn/garden pesticide with a diagnosis of breast cancer), and misclassified 40% of your D-E+ ('b' cell: people exposed to lawn/garden pesticides without a diagnosis of breast cancer) as D-E- ('d' cell: people unexposed to lawn/garden pesticides without a diagnosis of breast cancer).
This may happen in a case control study when both cases and controls under-recall their exposure status, but controls under-recall at a greater proportion than cases. This is common in case control studies; cases have likely been giving more thought to the potential exposures that may have caused their diagnosis.
8. What is the effect of this misclassification on the odds ratio?
| Scenario 3 | |||
|---|---|---|---|
|
Breast cancer +
|
Breast cancer -
|
Total
|
|
|
Ever used lawn/garden pesticides
|
1129
|
739
|
1868
|
|
Never used lawn/garden pesticides
|
365
|
797
|
1162
|
| Total |
1494
|
1536
|
3030
|
OR = (1,129/365)/(739/797) = 3.34
Your effect estimates have been inflated (i.e., biased away from the null). Why? The changes to your numerator offset the changes made in your denominator. Again, this is an example of differential misclassification because your exposure misclassification was based on disease status. In this case, the effect estimate was biased away from the null.
Scenario #4:
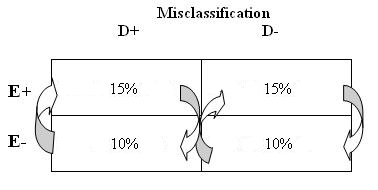
When compared with the "truth" you have misclassified 15% of ALL persons exposed to lawn/garden pesticide as non-exposed, and you have misclassified 10% of ALL non-exposed as exposed.
This could have happened in the Teitelbaum et al. (2007) study. For instance, one common lawn/garden pesticide was left off of the questionnaire, the interviewers did not ask about it and all those exposed to this particular pesticide were classified as unexposed. Thus, the exposure would not be based on diseased status - all individuals were not asked the question.
9. What is the effect of this misclassification on the odds ratio?
| Scenario 4 | |||
|---|---|---|---|
|
Breast cancer +
|
Breast cancer -
|
Total
|
|
| Ever used lawn/garden pesticides |
1090
|
1077
|
2167
|
| Never used lawn/garden pesticides |
404
|
459
|
863
|
| Total |
1494
|
1536
|
3030
|
OR = (1,090/404)/(1,077/459) = 1.15
Your effect estimates have been biased towards the null. Why? Look at your cells. Misclassification of exposure was NOT linked to disease status in this scenario, because exposure was misclassified consistently for both D+ and D- participants. Therefore, this is an example of non-differential misclassification, and non-differential misclassification biases estimates towards the null. (Aschengrau & Seage, pp. 278-281)
Scenario #5:
When compared with the "truth" you have misclassified 50% of ALL individuals truly diagnosed with breast cancer as non-diseased, and you have misclassified 30% of ALL truly non-diseased as having been diagnosed with breast cancer. For misclassification this serious to occur, you would have used a very bad measure of breast cancer in your study!
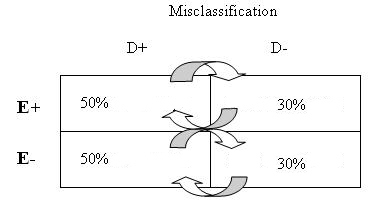
10. What is the effect of this misclassification on the odds ratio?
| Scenario 5 | |||
|---|---|---|---|
|
Breast cancer +
|
Breast cancer -
|
Total
|
|
| Ever used lawn/garden pesticides |
996
|
1489
|
2485
|
| Never used lawn/garden pesticides |
212
|
333
|
545
|
| Total |
1208
|
1822
|
3030
|
OR = (996/212)/(1489*333) = 1.05
Your effect estimates have been biased to the null (almost to the null of 1.0!). Why? Look at your cells and the magnitude of disease misclassification. This too is an example of non-differential misclassification because misclassification of disease was not linked to exposure status.